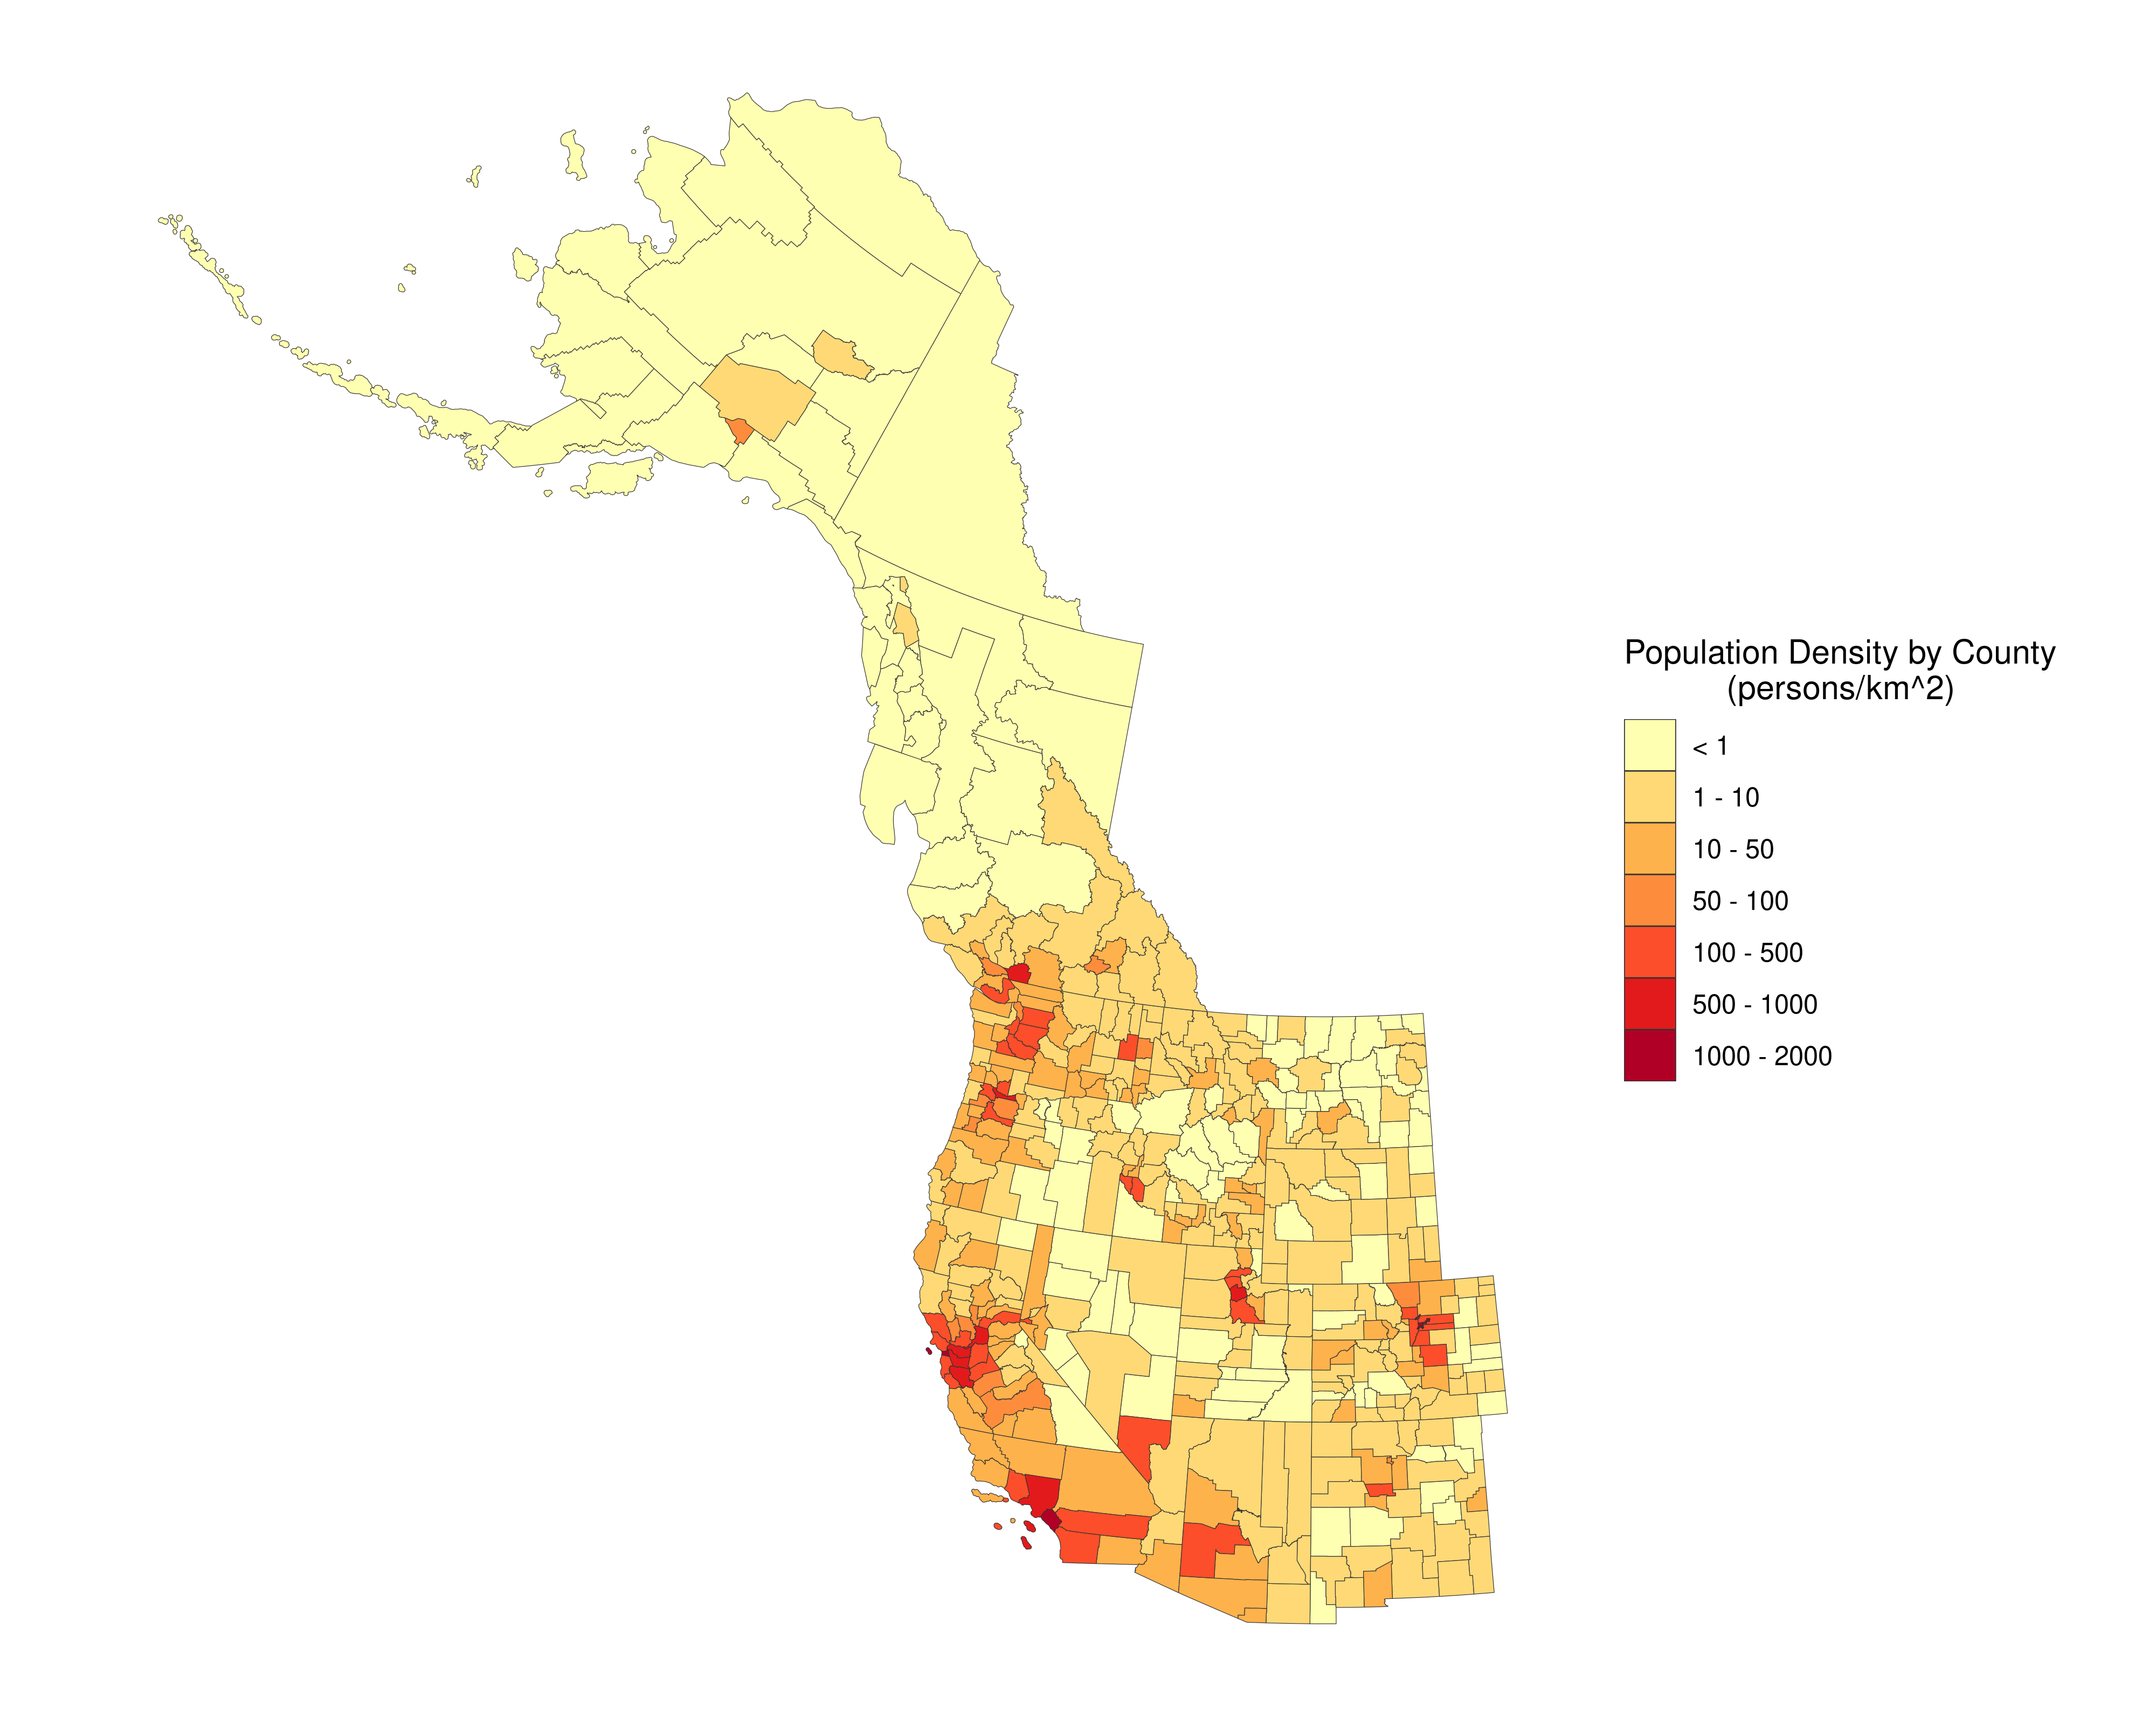
Mapping Population Density Across Western North America.
Using open census data from the United States and Canadian governments, I created a population density map looking at number of people per square-kilometer in each county. For Canada, I used county equivalents (“census districts”) for the province of British Columbia.
This map was originally created as a visual aid for the initial launching of the Western Wildfire Resilience Index website. Although my official job title at NCEAS is project manager, I was recently able to flex my spatial analysis and mapping skills to reduce the workload of the data analysts on my team. As PM, it’s my responsibility to make sure the project is moving along efficiently, often times with multiple things at once. To ensure the data analysts on my team were able to meet other deadlines, I decided to take on the responsibility of creating this visual for our project’s website.
The project specifically defined “the West” of Canada to include British Columbia and the Yukon Territory provinces. For the United States, “West” was defined as including the following states: Alaska, Arizona, California, Colorado, Idaho, Montana, Nevada, New Mexico, Oregon, Utah, and Washington.