Graphing Colorado’s Predicted Snowfall, 2020-2080.
time series
R
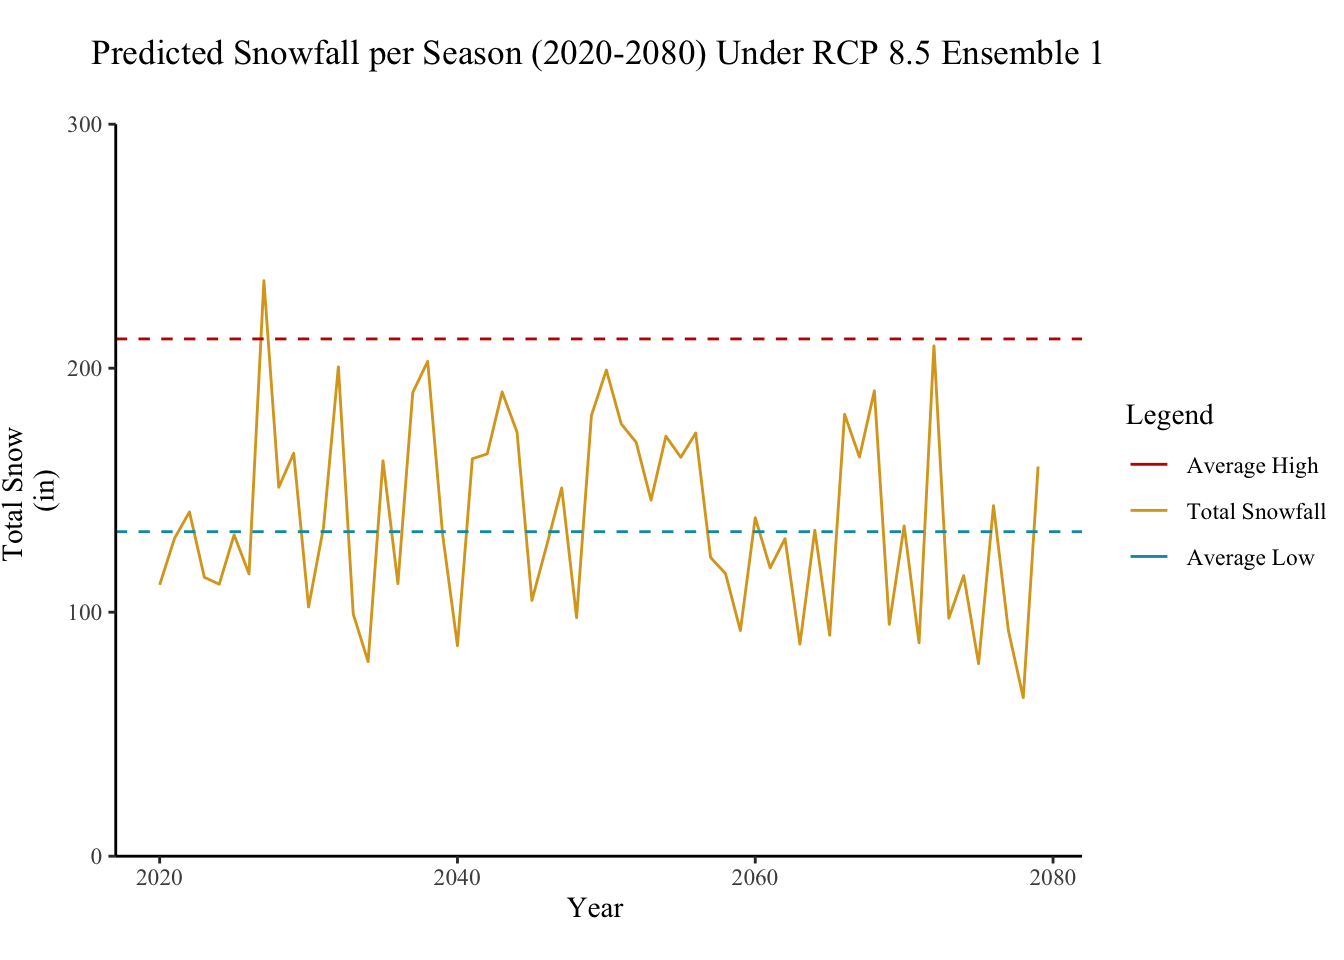
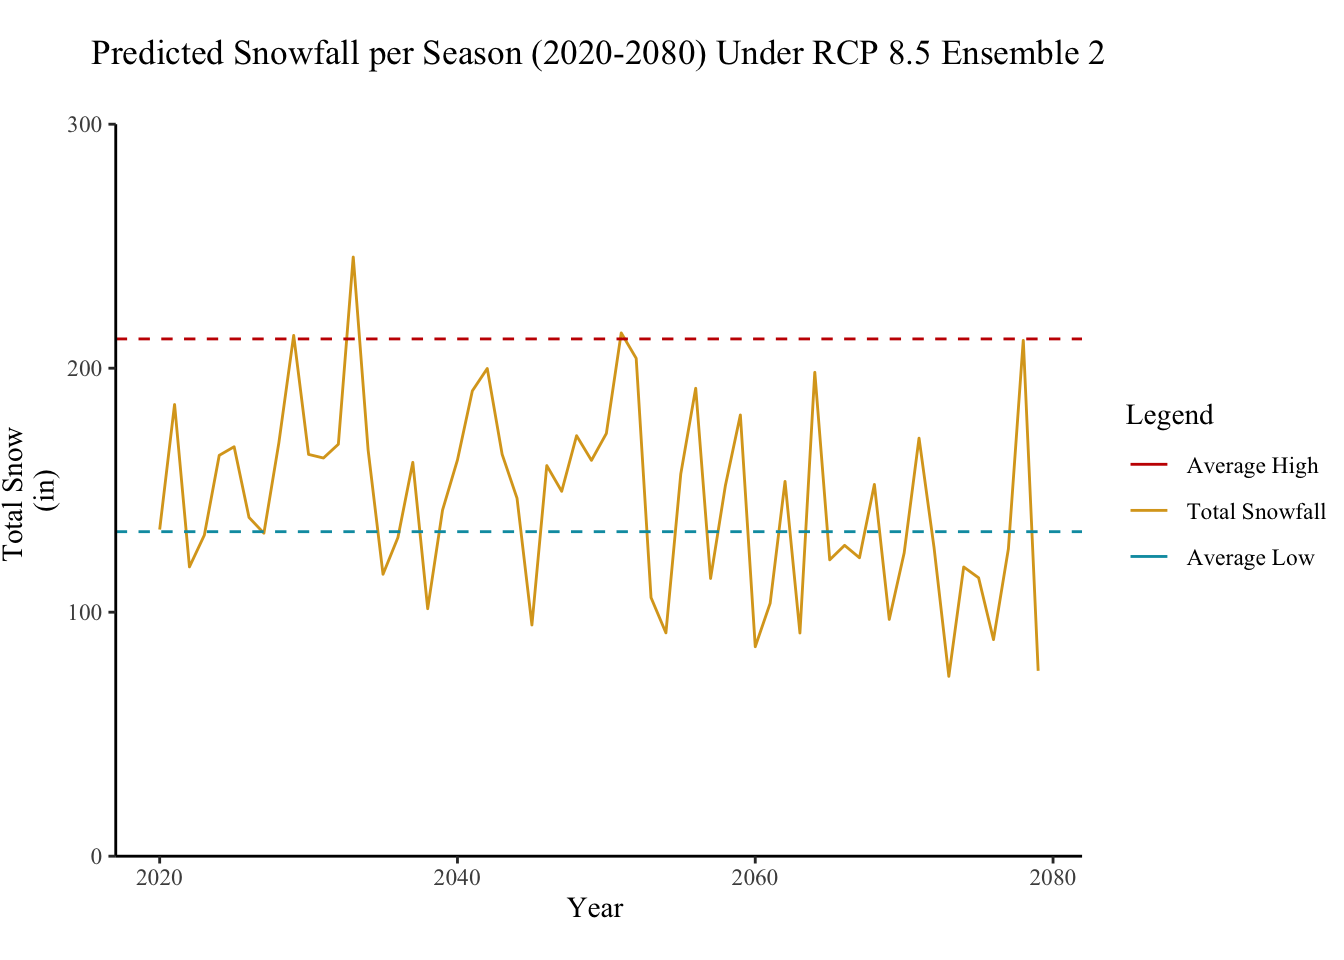
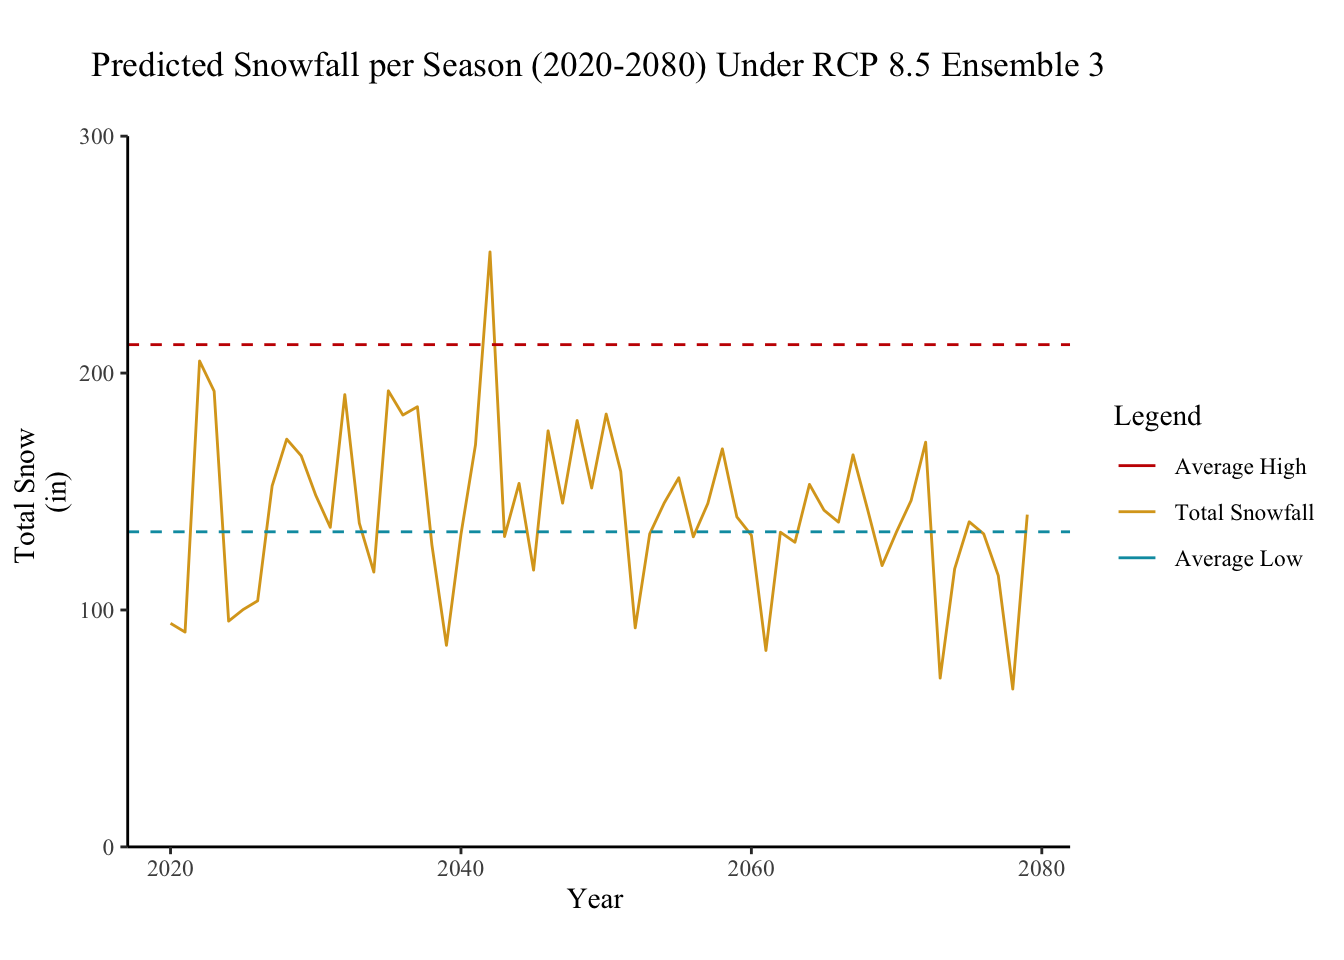
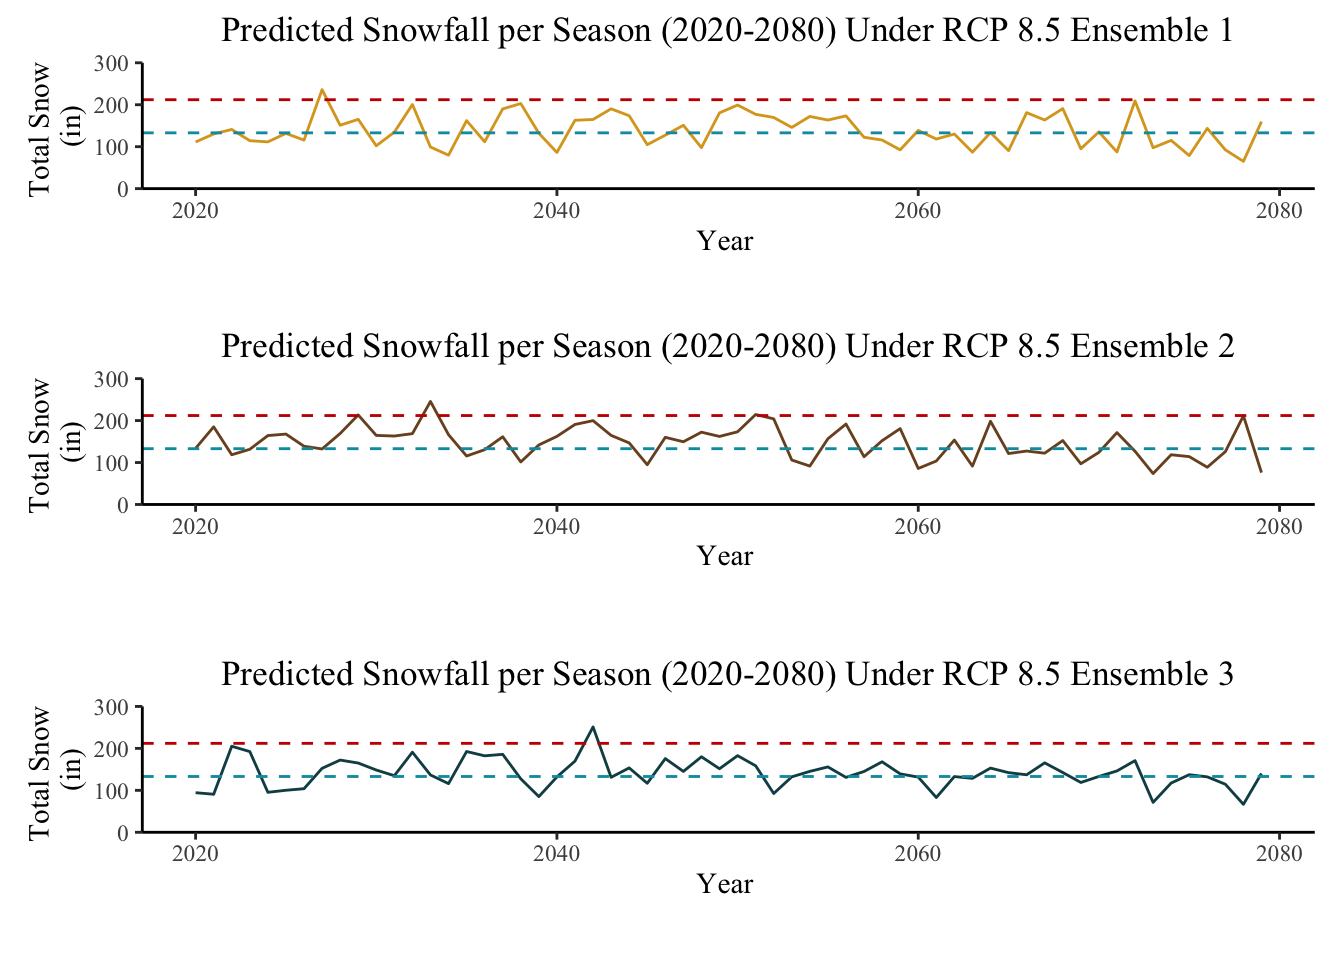
Using open climate data from the University of Colorado Boulder, I created a time series plot of predicted snowfall during ski seasons between 2020-2080. The graphs illustrate predicted snowfall for three separate climate ensembles.
The following time series graphs are examples I created using publicly accessible data from the Community Earth System Model (CESM) at the University Corporation for Atmospheric Research (UCAR). These graphs were created as part of a graduate-level course assignment on Climate Change Impacts and Adaptation (Spring 2020), taught by Prof. Samantha Stevenson.
The source code for the graphs can be found here. For context, the graph within the ‘’All Ensembles’ tabset is the original assignment submission. The graphs within the remaining tabsets have been updated to include a legend.